We draw together different strands of evidence that point to multiple dimensions of inequality stemming from a similar source. They start in product markets, extend through the labour market and cast across large parts of the financial markets.
A particularly pertinent conclusion is that it seems likely that, over the last decade, the dollar has benefitted from the same forces that have caused income inequality to increase.
The core pieces of evidence that we draw on are as follows:
- The labour share has fallen, whilst measures of income and wealth inequality have increased;
- The decline in the labour share can primarily be explained by an increase in market concentration rather than the behaviour of individual firms;
- At the same time that market concentration, income and wealth inequality have all increased, so have measures of ‘equity market inequality’;
- The US has increasingly been the primary beneficiary of these trends over the last decade, driving up the value of the dollar.
The first dimension: product markets
The starting-point for our analysis is two highly insightful pieces of work by David Autor and colleagues on the reasons behind the decline in the labour share over the last two decades (see the bibliography for details).
They demonstrate that the primary factor driving the decline in the labour share in the US is the competitive gain made by more capital-intensive firms. As these firms took market share, the overall contribution of labour to value-added / national income fell. They further show that the increase in market concentration as capital intensive firms dominated is not confined to one part of the economy, but instead broad-based. They use this analysis to motivate an economic model in which ‘superstar’ firms come to dominate the market, providing a range of possible explanations for why this might have come to pass.
The second dimension: the labour market
Autor et al’s work is most detailed on the US due to the limited availability of concentration data in other countries. Nonetheless, they argue that similar trends are likely at work elsewhere and that the decline in the labor share cannot simply be explained by increased trade, the decline in the significance of manufacturing, de-unionisation or other institutional factors that are sometimes used to seek to explain the trends in the labour share as well as income inequality.
Because our main focus is on the international transmission of this market change and because concentration data outside the US are limited, we do not seek to replicate their analysis of the change in market concentration. Nonetheless, as a reminder, in the charts below, we show the changes in US income and wealth inequality outright and relative to some of the other countries with comparable data.


The third dimension: financial markets
The link into market behaviour from this analysis comes from two papers written recently by Cliff Asness and his AQR colleagues (see the bibliography for details and links). They focus on a value-based strategy that systematically buys stocks trading at low price multiples relative to more expensive stocks. The motivation for this strategy has long academic roots and is viewed as one of the core ‘factors’ that delivers persistent returns – not just in equities but in a range of asset markets.
Asness shows that the valuation discount for stocks that would be bought as part of this systematic value strategy has, under a range of definitions, risen to historic extremes. Although the motivation for the AQR analysis is to argue that the strategy continues, in their view, to be an attractive one, for our purposes, we can extract some useful additional facts from their analysis:
- Similar to the evidence from Autor’s work on concentration, the increase in ‘equity market inequality’ (i.e. the increased premium relative to a fundamental metric such as book value, sales or earnings for the most expensive stocks relative to cheaper stocks) is widespread and not isolated to, or explained by, a single sector;
- Similarly, it is not restricted to one specific metric, but broadly based;
- Although the periodicity of the ‘equity market inequality’ metric is extremely high compared with the data on inequality or market concentration, from Asness’s charts, we can nonetheless see the same broad drift towards inequality on this metric (starting in the late 1970s or early 1980s) as for measures of income inequality or market concentration.
The link this suggests to the analysis presented by Autor et al is both simple and powerful: at the same time as market concentration has increased, the equity market has been increasing the premium at which it is willing to buy the stocks of market-leading companies: investors have become increasingly convinced that today’s winners from market concentration will remain winners in the future.
As we show below, this has been particularly true over the last decade. This naturally generates two questions:
- Are the factors generating market concentration ones that are sustainable or in any way predictable?
- Are other assets affected beyond the equity market?
The determinants of the rise in market concentration are discussed by Autor et al without it being the primary focus of their work. They argue that there might be a benign explanation, with increased returns to scale prompting the initial gains in market share while rapid innovation and productivity gains could be required to sustain it. However, they acknowledge the possibility of a less benign rationale, where barriers to competition allow market leaders to extract oligopolistic rents, with the market becoming increasingly willing to discount those rents into the future.
Broad evidence on this is less readily available, but Simcha Barkai (see bibliography for details) argues that the capital share (as distinct from the profit share) has fallen at the same time as the labor share, which makes a less competitive outcome likely.
If correct, changes in political attitudes towards competition policy – particularly in the US but also in other countries – that cause the market to downgrade expectations of the sustainability of “winners’ earnings potential” will feed through not only to equity multiples but have a broader impact on asset allocation.
In considering the further ramifications of the increase in concentration and ‘equity market inequality,’ the one that immediately stands out is the way in which the US has been a winner from increased inequality both in equities and FX over the last decade. Taking earnings expectations as a smoother proxy for actual earnings, the chart below shows the extent to which the US has persistently outperformed the global equity market since 2011.
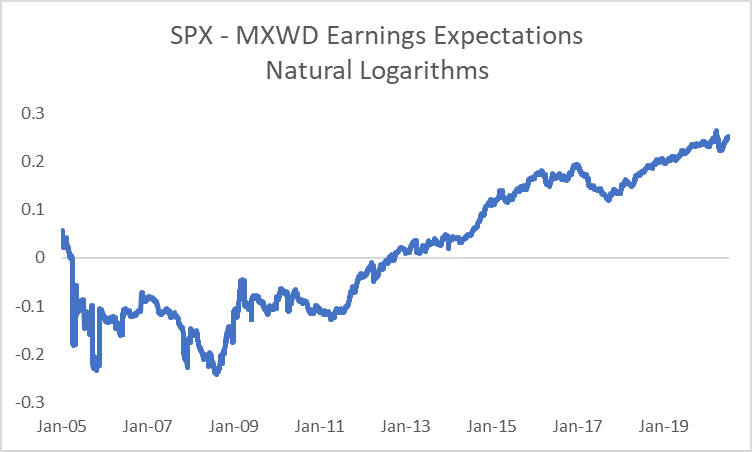
The two charts below show the linkage between p/e multiples across countries and the richness of the dollar:
- The upper chart compares the multiple of price to expected earnings for the S&P 500 relative to MSCI World alongside the IMF’s measure of the USD real exchange rate;
- The lower chart – at much reduced periodicity – compares relative p/e spreads and the deviation from purchasing power parity for an equally-weighted basket of G5 currencies – a GDP-weighted basket is similar, chart available on request.


We can conclude that market concentration, income inequality and the dispersion of equity market multiples have all increased over the last two decades. Companies quoted on US equity indices have been the primary beneficiaries from the increase in market concentration, attracting capital inflows in a way that has caused the dollar to appreciate.
Long-running trends always deserve respect: their robustness generally requires a significant countervailing force to cause them to reverse course. The counterpart, however, is that as the driving-force behind a trend impacts a wider range of assets, it typically loses intensity and becomes more vulnerable, both to economic competition and to the political process.
The commentary contained in the above article does not constitute an offer or a solicitation, or a recommendation to implement or liquidate an investment or to carry out any other transaction. It should not be used as a basis for any investment decision or other decision. Any investment decision should be based on appropriate professional advice specific to your needs.
Bibliography
C. Asness, Is (Systematic) Value Investing Dead?, AQR, May 2020
D. Autor et al, Concentrating on the fall of the labor share, January 2017
D. Autor et al, The fall of the labor share and the rise of superstar firms, October 2019
S. Barkai, Declining labor and capital shares, 2017
R. Israel, K. Laursen, S. Richardson, Is (systematic) value investing dead?, AQR, March 2020
M. Sandbu, The Economics of Belonging, LSE Webinar, June 2020
