A brief retrospective on the economic cycle that peaked at the start of 2020, as condensed into one chart.
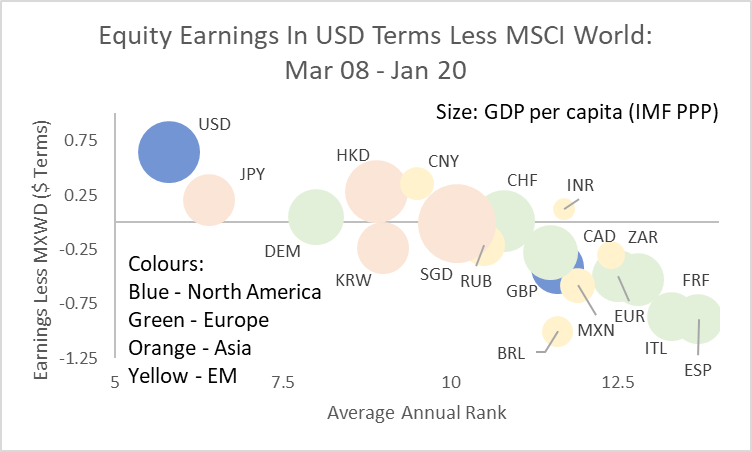
The chart shows the change in equity earnings expectations as measured by Bloomberg from March 2008 (the peak prior to the Lehman crisis) to the latest peak in January 2020. The y-axis shows the difference in earnings expectations between each country and MSCI World. The difference is calculated in USD terms at prevailing exchange rates. The x-axis shows a country’s annual average rank for earnings expectations (lowest rank equals best earnings). The size of the bubbles reflects each country’s current GDP per capita as reported by the IMF.
The chart reveals some key aspects of the last cycle:
- The US was dominant – not only did it outperform through the cycle but it had the best annual average rank of all the countries (meaning its earnings growth was consistently among the highest);
- Global earnings growth was highly unbalanced: apart from the US, only four of the markets shown here saw earnings expectations grow by more than the MSCI World in USD terms – of those, three were in Asia;
- It was a terrible cycle for Europe: earnings performance was consistently poor for the euro area in aggregate, as the corporate sector in southern Europe went through an aggressive deleveraging; the large divergence between Germany and the southern European countries highlights an unresolved internal pressure.
Although only coined in the second half of the cycle, “America First” was an accurate epithet.
Implicit rather than explicit in the chart is the result for portfolio positioning. Although seemingly paradoxical, for many, the culmination of two decades of globalisation has been increased concentration on a single equity market.
Why did this happen? Three factors in particular stand out:
- Globalisation was broad, deep and powerful: its most extreme beneficiaries were the owners of capital relative to unskilled labour in developed economies, in particular;
- Technological change allowed the effects of globalisation to extend further and faster than historical parallels would have suggested: winner-takes-all innovations provided significant market power to those able to build initial market share;
- Monetary policy – especially US monetary policy – was dominant: the central bank reaction to the 2008 crisis was to err towards providing more than enough liquidity to ensure that new sources of credit stress could not gain traction; with money velocity depressed, the result was the maintenance of low yields that enhanced the present value of tech companies’ long-dated earnings expectations.
Each of these factors seems set to weaken or be replaced in the coming cycle, with potentially significant consequences for how long-dated asset owners’ portfolios should be structured.
The commentary contained in the above article does not constitute an offer or a solicitation, or a recommendation to implement or liquidate an investment or to carry out any other transaction. It should not be used as a basis for any investment decision or other decision. Any investment decision should be based on appropriate professional advice specific to your needs.
