A brief annotation of the bifurcation between April’s market recovery and the underlying deterioration in fundamental conditions, summarised in six charts.
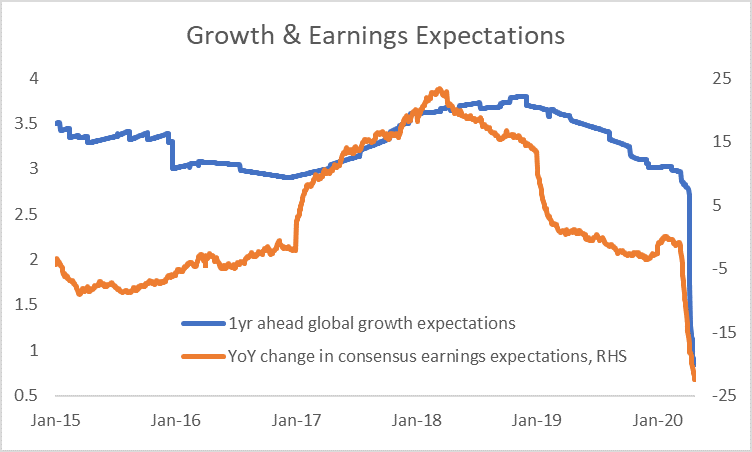
The underlying hit to growth expectations continued to build as the first post-lockdown data were released.
Since the beginning of March, the change in earnings expectations has been particularly severe for US cyclicals and European banks. Adjusted for the longer term volatility of expectations, the change at the broad index level in the US and Europe has been greatest.
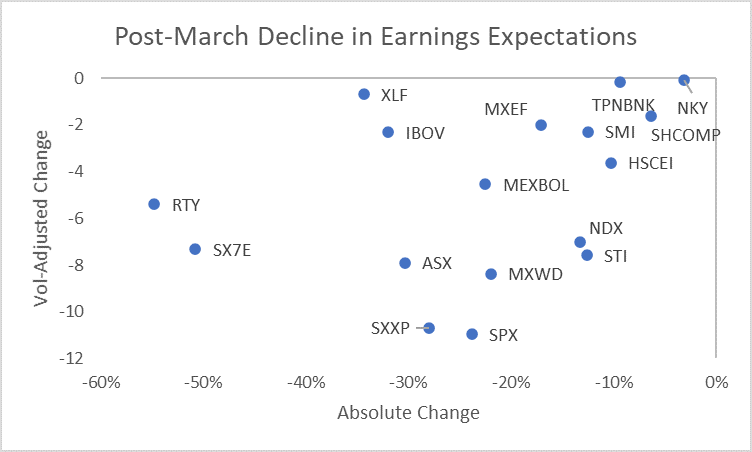
post-2005 monthly volatility; Source: Bloomberg
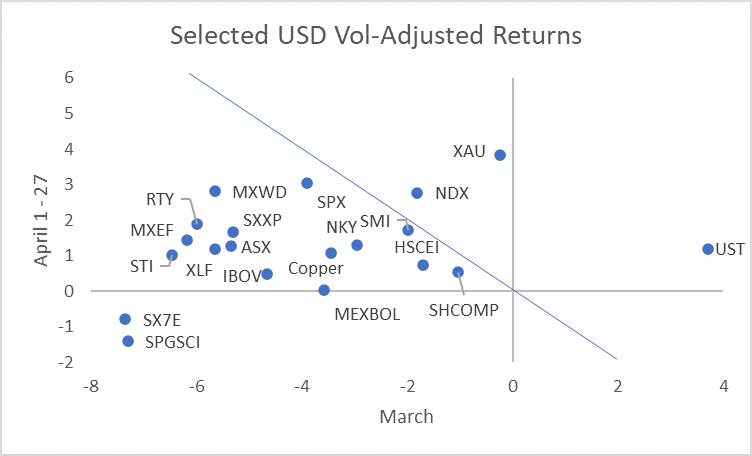
The market traded liquidity in preference to fundamentals in April. Looking at performance across March and April, the clearest beneficiaries from central bank liquidity were Treasuries, long duration equities (last cycle’s winners) and gold. Commodities and European banks failed to benefit much if at all.
The effects of the central bank liquidity injections and asset purchases on the demand for protection against further asset market shocks was evident in the large-scale retracement of the earlier surge in implied volatility. The chart shows the cumulative Z-score based on data since 2001.

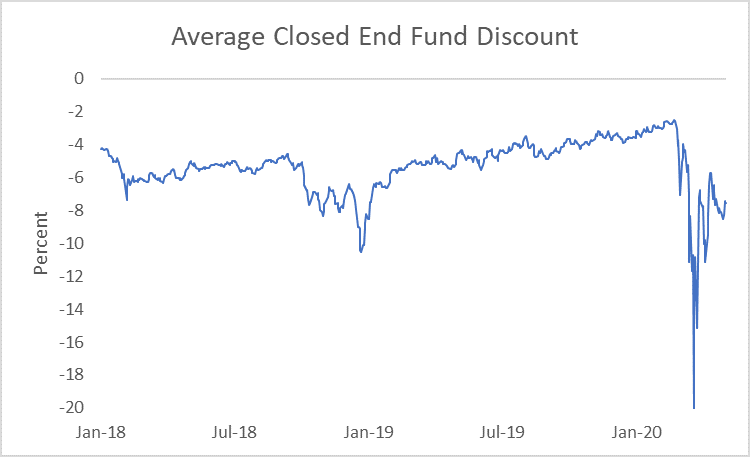
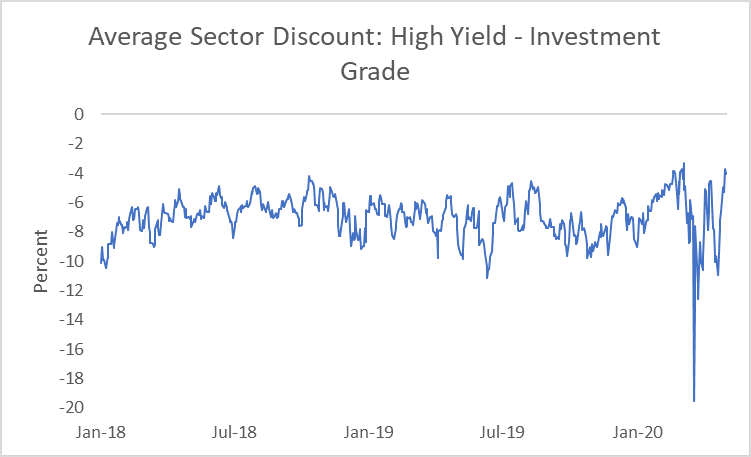
Other measures of liquidity risk in many cases improved further. Our measure of the closed end fund discount has not fully recovered from its March collapse, but has returned to levels that suggest much greater confidence in the pricing of assets and the ability to generate cash from less liquid holdings if required.
The effects of the Federal Reserve’s interventions were particularly notable in the US High Yield market to the extent that the discount for funds in that sector relative to Investment Grade funds is now towards the tightest it has traded at since 2015.
construction details; Source: Bloomberg
